
(Updated)
Not all data is good quality, and a common driver of poor quality is a lack of data completeness. Completeness is one of 10 standards for data quality:
- Accessibility,
- Accuracy,
- Comparability,
- Consistency,
- Credibility,
- Relevance,
- Timeliness,
- Uniqueness,
- Reasonableness, and
- Completeness
In a sentence, data completeness is the percent of all required data currently available in a dataset. It’s the result of a phenomenon in which few datasets are ever 100% complete.
In fact, in a small survey I did with 10 database engineers and database managers, 8 responded that they have never seen a complete dataset — that is, one that didn’t require at least one manual entry. The other 2 respondents said they have seen complete datasets, but only in pre-processed systems. Complete data is hard to come by.
The purpose of this article is to outline types of data completeness, show common examples, explain how to test for data completeness in Excel and Tableau, and show data completeness’ role in quality assurance.
Don’t forget, you can get the 67 data skills and concepts checklist for free to ensure you’ve got your bases covered (including data completeness).
Why is incomplete data bad?
When data is incomplete, it’s unreliable. This means any analysis of that data is also unreliable, thus the saying, “garbage in, garbage out.”
Types of Data Completeness
Data completeness is important in data models, data schemes, and data objects, but it appears most often in data tables.
Data tables

What is a data table? Data tables consist of columns and rows in which the first contains unique IDs of each observation and the following column headers contain a data point or characteristic about those unique IDs.
What is incomplete data in data tables? When we talk about data completeness, the most common situation analysts encounter is empty cells in a data table as shown in the image above.
How can you fix it? There are two ways to fix incomplete data in data tables. Either your correct the source data upload, or you manually enter the correct values. Manual entries can take on many forms, but two common ones are closest copy and moving average (click here to see the section below).
Data models

What is it? Data models show 3 things: 1. the name of the data table under question, 2. the primary key of the table, 3. what fields are in the underlying tables, and 4. how those each section relates to the others (not shown above).
Most often, it is shown as a system of boxes that carry data observations and corresponding attributes. Because these boxes show only column headers of an underlying data object, they can be considered a derivative of the latter.
What data go missing most often? Data goes missing from data models in two ways: either the underlying table is missing data, or the model itself is missing observation IDs or attributes.
How can you fix it? When the data model is not automatically generated from the data source, completing data in the data model is easy. You simply fill in the missing point manually. However, when it comes from the source data, you’ll need to use the Closest Copy or Moving Average techniques discussed below.
Data schema

What it is? A data schema, also called a physical data model, is visual summary of a data table. In many cases, it is synonymous with a data model. However, schemas add more details, such as data types, format types, and number of characters.
What data go missing most often? Data schemas sometimes contain logical sentences, which can sometimes be mis-worded or can miss entire arguments. In addition, data specifications in the schema (the red text in the image above) can be missing or incorrect, which causes both the schema and any data tables it prints to be incorrect.
How can you fix it? Similar to data models, data schemas can be generated automatically from underlying data tables. When they are, data analysts needs to examine the source data, which we’ll look at below. If not, it’s simply a question of examining the logical structure or schema output to identify the missing data and fill it in manually.
Data objects
What it is? Formally, a data object is a group of 2 or more data points that create meaning as a whole. Examples include arrays, pointers, records, files, sets, and scalar types. Data tables are also a type of data object, but we generally consider them separately.
What data go missing most often? Depending on the data object, it’s the data values themselves that go missing. In an array or record, a cell may be empty. In files or pointers, it could be a piece of underlying code that’s miswritten. Click here to learn more about data objects.
How can you fix it? Since data objects contain data themselves, you need to go through the object columns, rows, or code to make a manual change.
Data Completeness Testing: How to Determine if Your Data is Complete
To test for data completeness (rather, to test for data incompleteness), analysts often start by employing sanity checks on their results. The steps an analyst might follow include:
- Before analysis, scroll through and quickly look at the data table to identify any glaring issues, such as huge amounts of empty cells. You can do this in Excel or on the Data Source page of Tableau.
- Perform analysis and identify outputs that simply don’t make sense, such as extremely high or low numbers.
- Use a COUNT() function in Excel or Tableau on the column in question to see if there are any data points missing.
- Check aggregate amounts, such as SUM, MAX, MIN, & MEDIAN, on the raw data to see if they makes sense.
- Take a random sample of 5% of total rows and copy them to a new sheet in Excel. Examine the completeness of their data one-by-one.
We call these steps sanity checks because they aim to “test” the data using inductive reasoning — taking partial information and estimating its reasonability within the whole. They are not full-proof techniques, since parts of the whole may in fact not be representative.
ETL Testing is the Only Full-Proof Test
Full proof data testing is only possible using software. Intuitive techniques such as sanity checks do not cover the full set. In data sets with a large amount of rows and columns, no amount of sanity checks will guarantee completeness of cells. You need an ETL testing software.
ETL testing stands for Extract, Transform, Load, and its purpose is to extract large data sets, transform them into a uniform table with consistent data types, and finally load it back into the database to be stored. This software is not designed to fill in empty cells to complete the dataset, but it will identify the gaps.
If you’re new to ETL software, you can check out free, open-source software such as Apache Airflow. Some ETLs have data completeness add-ons, but they’re almost always paid services.
How to Fix Incomplete Data
In most cases, fixing incomplete data consists of manually entering empty cells.
Either you locate the correct data from another source (invoices, questionnaires, etc.), or you use dummy data to fill in the gaps. Analyst use many techniques to fill in the gaps, but two common ones are closest copy and moving average.
Closest Copy Technique
The closest copy technique implies taking the closest similar live data point and copying it into the empty point as dummy data. For example, imagine you have a marketing cost for January – March and for May – December. The only point you’re missing is April. The closest copy technique would suggest you take the data for either March or May and copy it into the April point.
Moving Average Technique
A forecasting technique for time series data, moving averages use an average of relevant preceding data to calculate dummy data. For example, to predict rainfall in April, you would take the average of rainfall from January to March. It’s simple, yet highly effective.
Data Completeness in Quality Assurance
The reason analysts want data completeness is to obtain accurate results. As the old saying goes, “what goes in comes out.” If you feed your analysis with incomplete data sets, then you will get incomplete results. But if you feed it with complete data, then your results will be reliable. This concept in data analysis is called quality assurance.
The goal of using the different dimensions of data quality (accessibility, accuracy, comparability, consistency, etc.) is to produce quality analysis, and data completeness is a key dimension to do so.
Example in Excel
Imagine you run an e-commerce company that sells watches. You have a database of customers and their purchases, with data based on invoices. A snippet of that database might look like the following:
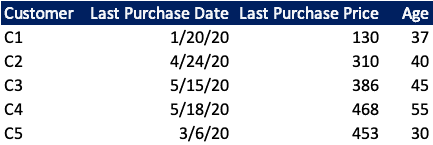
As it stands, this snippet is complete. There is no missing information. However, when we expand our field of view, we see that there is some data missing. Our set is not complete:

Here we only have 30 customers, but imagine the dataset extends much further — 2000 rows. You want to get an idea for how much data is missing. In this case, you would use one of the sanity check methodologies.
Personally, I would use a COUNT() formula on each column to find out how many cells are missing. This is quite simple in Excel: place your curser below the column “Last Purchase Data” column and type =SUM(.
Then highlight the whole column, close the brackets, and your formula should look like this: =SUM(B2:B2001). Hit Enter, and you’ll have the count of filled cells. Do the same for the other columns.
Then you will need to decide how to fill in the data. Since this data is not time-based, you really only have one option: closest copy. In this case, all of filled purchase price and age fields are stable reference points. I would use an average of each to fill in the empty cells. For example, to fill in Customer 8’s Last Purchase Price, the formula might look like the following:

Conclusion
If you found this article helpful, feel free to check out more free content on data, finance, and business analysis at the AnalystAnswer.com homepage.
